Good morning. As a point of introduction, my name is Mark and I am relatively new to the game. I am in the Gas production business and I have the entire tree built (power, oil well, factory, gas station).
I have read I believe every thread in the Questions & Beginner Help forum and am trying to determine if there is a steadfast formula to use in determining the price to charge when selling in your own station. I know that you must take into consideration the cost of your product, but is there an exact formula to use?
Also, I know that another way to operate is for me to purchase the gas (on the market or by contract) and then resell it at my station. I am currently producing Q0 gas and I noticed that has been selling around 9 by contract. I was able to purchse 2000 Q4 gas at 12 with the intent of reselling it at my station. Any suggestions? Any formulas which I should consider.
Thanks in advance and I am looking forward to learning and building.
MLS Enterprises
CEO Mark
Formula for Selling (Pricing)
Moderator: moderators
-
Guest
Creating a generalized formula is very difficult. The variables change from product to product, quality to quality, country to country, and even week to week. However, it's pretty easy to make a customized graph for yourself.
I don't know if you have a selling store yet, but you may have noticed that you can change the price easily after a quantity of good are listed. If you do that with a few price points and record the time, you can get a good market snapshot.
Here's how I then set it up in excel
Cost ... Quantity ... Selling Price ... Time to sell in minutes ... Profit (Price-Cost)*Quantity ... Profit / minute
That gives me 6 simple columns. The first two are fixed. Make sure you use market cost, not raw cost - after all your factories deserve to get paid too. Quantity can be any number, it all works out - but using the max the store can hold is a pretty standard practice.
Selling price you vary in increments from way above to way below. Time you will be told based on the price and you copy that in. The last two columns are derived.
Then I graph column 3 vs 6. I want to see how the Price (x axis) will affect my profit / minute (y axis). It looks like this:
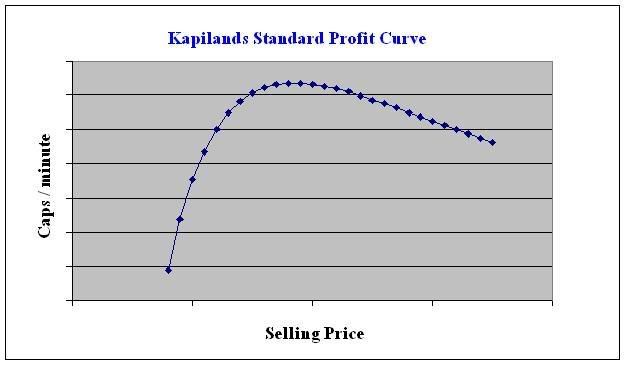
The numbers shift as discussed above but that's how the graph will look every time. Looking at that it's easy to pick out the highest point - that's where your store is the most profitable.
So that's the price you sell at? Well, maybe. Let's call that price A.
Price B is based on how much you can get. Selling out fast and then sitting empty would be a waste. So if your factories can only make, say, 750 gas in 6 hours, then price B would be whatever results in selling 1500 at 6 hours.
Price C is based on how busy you want to be. You can't be checking the game all the time (even if it seems like you are ). So price C is based on how much your store can hold (1000 for a 20-foot Gas Station btw), and how often you want to check. A lot of people, myself included (usually), just set a price that lets you sell a full store's worth in 12 hours.
So here's our 3 prices:
A) Market-derived, max store utility
B) Production-derived, focus on own supply
C) Time-derived, focus on RL schedule
B) you can toss out if the market is robust, or focus on if it's not. The gas market is pretty good, you can just about always get more gas at some reasonable price, so you don't have to worry about making your own. However, if you were selling, say, Beds, there aren't many on sale and the price can vary wildly so you wouldn't want to sell more than you can make.
Then pick the highest of the 3 prices.
Hope that helps. It's a little complex but you sound like you can handle it.
I don't know if you have a selling store yet, but you may have noticed that you can change the price easily after a quantity of good are listed. If you do that with a few price points and record the time, you can get a good market snapshot.
Here's how I then set it up in excel
Cost ... Quantity ... Selling Price ... Time to sell in minutes ... Profit (Price-Cost)*Quantity ... Profit / minute
That gives me 6 simple columns. The first two are fixed. Make sure you use market cost, not raw cost - after all your factories deserve to get paid too. Quantity can be any number, it all works out - but using the max the store can hold is a pretty standard practice.
Selling price you vary in increments from way above to way below. Time you will be told based on the price and you copy that in. The last two columns are derived.
Then I graph column 3 vs 6. I want to see how the Price (x axis) will affect my profit / minute (y axis). It looks like this:
The numbers shift as discussed above but that's how the graph will look every time. Looking at that it's easy to pick out the highest point - that's where your store is the most profitable.
So that's the price you sell at? Well, maybe. Let's call that price A.
Price B is based on how much you can get. Selling out fast and then sitting empty would be a waste. So if your factories can only make, say, 750 gas in 6 hours, then price B would be whatever results in selling 1500 at 6 hours.
Price C is based on how busy you want to be. You can't be checking the game all the time (even if it seems like you are
So here's our 3 prices:
A) Market-derived, max store utility
B) Production-derived, focus on own supply
C) Time-derived, focus on RL schedule
B) you can toss out if the market is robust, or focus on if it's not. The gas market is pretty good, you can just about always get more gas at some reasonable price, so you don't have to worry about making your own. However, if you were selling, say, Beds, there aren't many on sale and the price can vary wildly so you wouldn't want to sell more than you can make.
Then pick the highest of the 3 prices.
Hope that helps. It's a little complex but you sound like you can handle it.